The Dashboard analytics view allows you to view your total engagement, per channel, across a set time period and compare it to the same previous period. You can view the last 7 days and compare it to the previous 7 days. Other options are monthly or set your own custom dates.
The engagement metrics are slightly different in each channel and will show the percentage increase or decrease compared to the previous period.
-
Email - measure your open and click through numbers and see if you've had an increase from the previous period.
-
Facebook - measure clicks on your post and the number of times it has been viewed
-
LinkedIn Business - measure clicks on your post and the number of times it has been viewed
-
LinkedIn Personal - measure the number of likes and comments
-
Twitter - measure the number of likes and shares
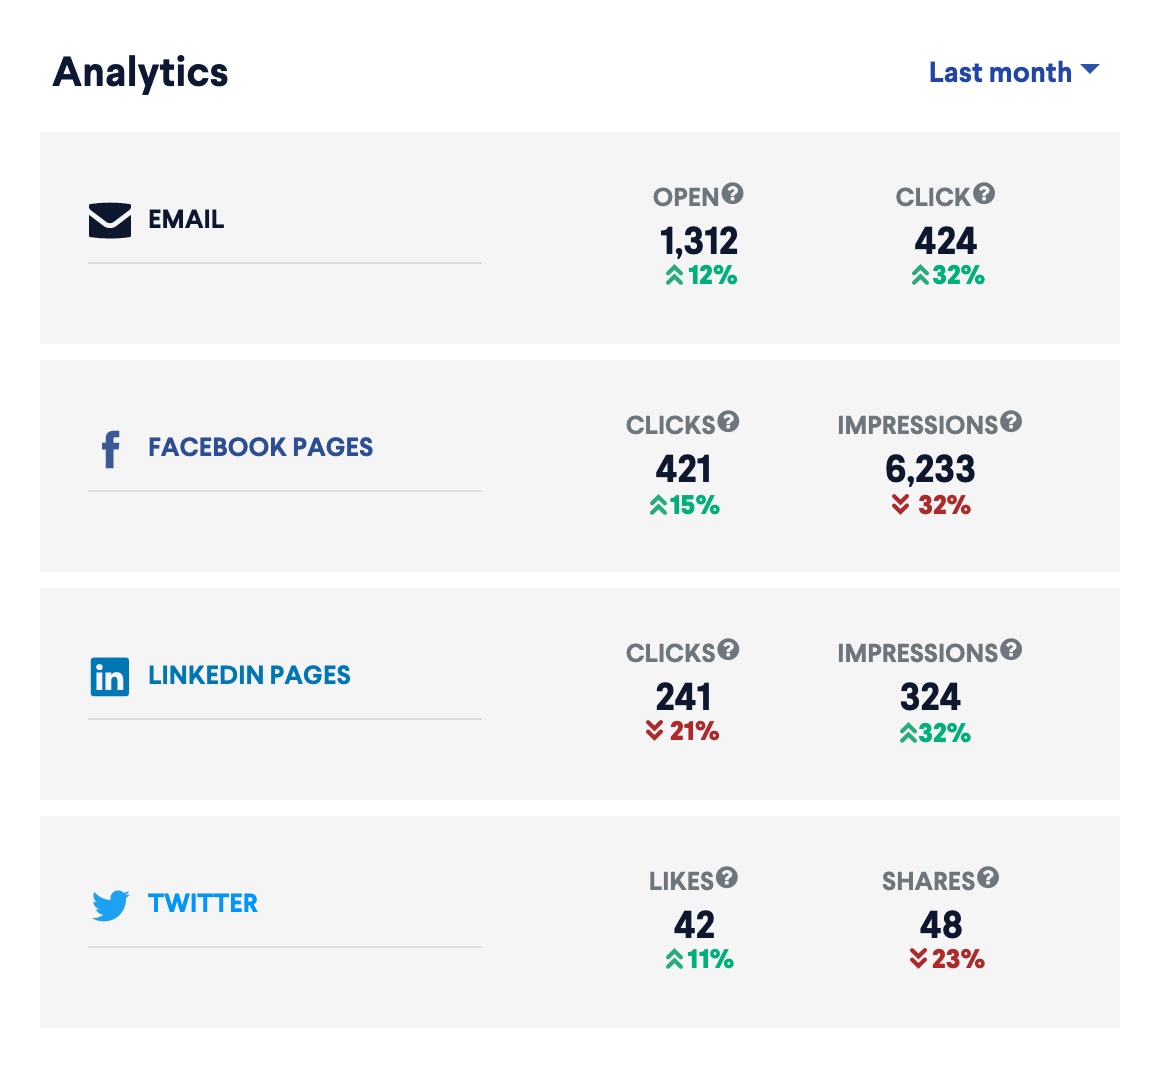
In the above image you can see that over the last month, there has been 1312 emails opened. This in an increase of 12% from the previous month. By hovering your mouse over the percentage change, you can view the previous period's quantity. \
You can also check the analytics of a particular campaign on the Campaigns tab and clicking on your campaign.
Further Reading: