You can view performance data on recent campaigns in your BOMA account.
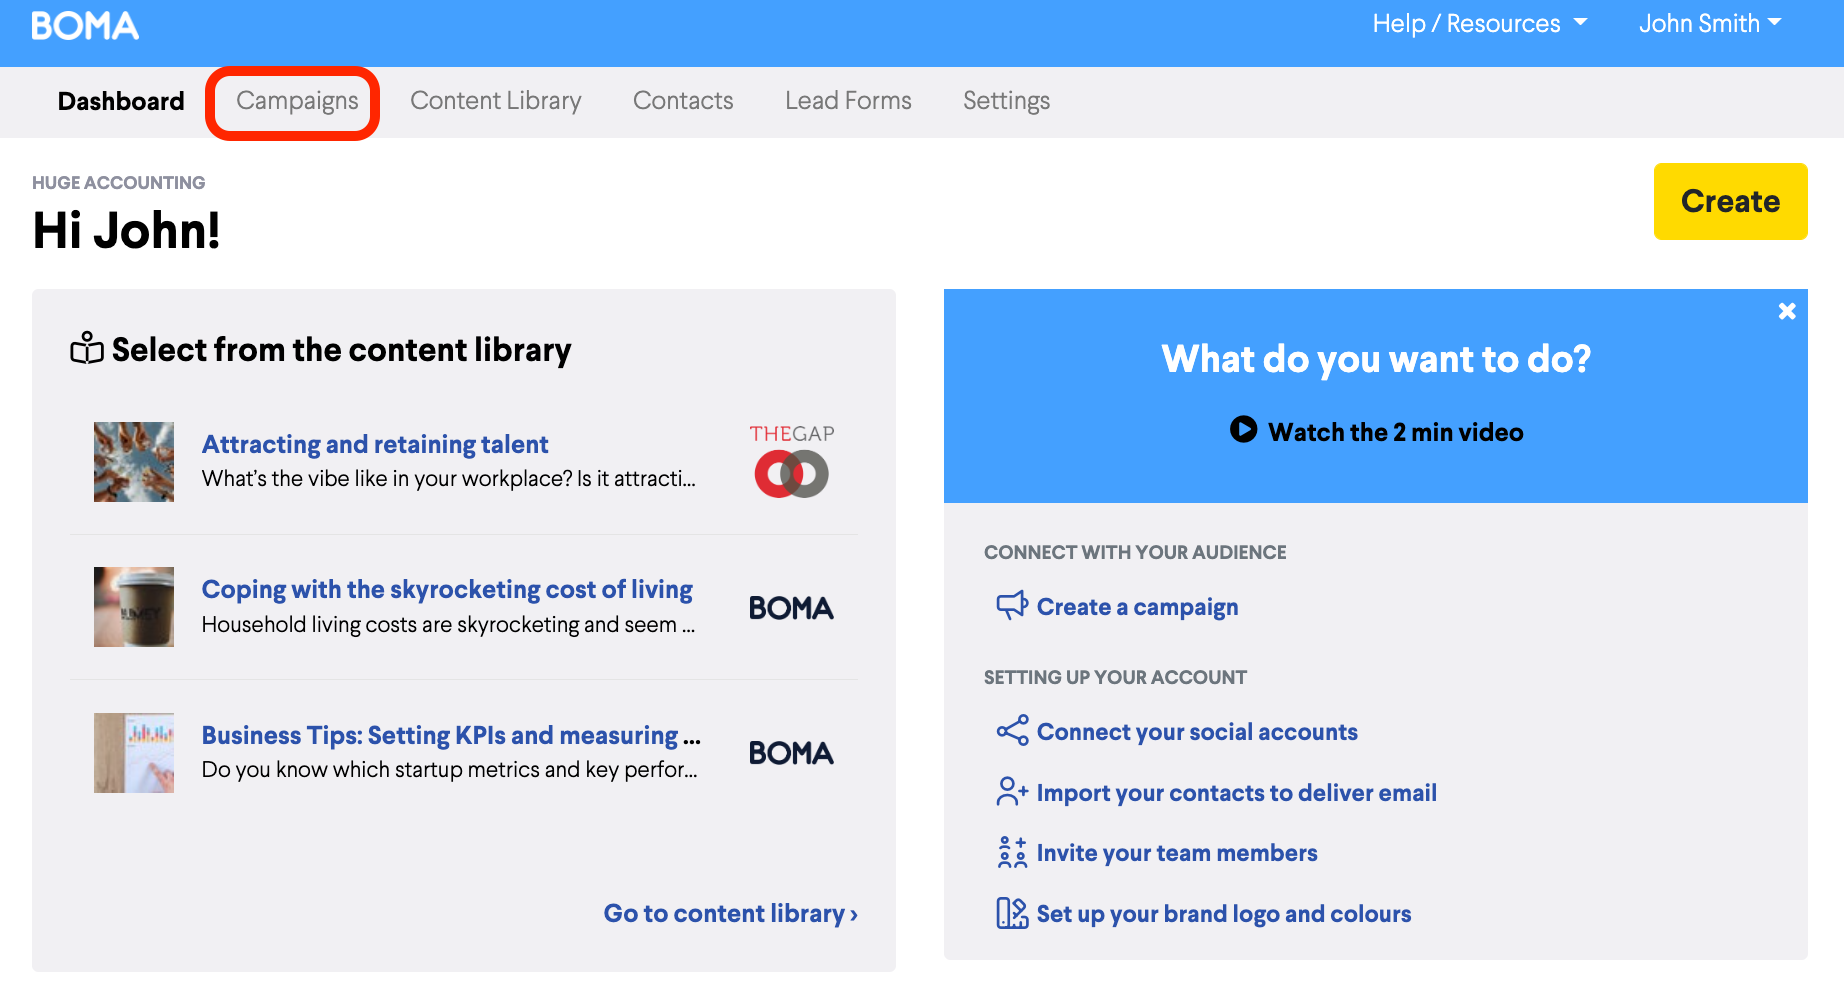
From the dashboard, click on Campaigns.
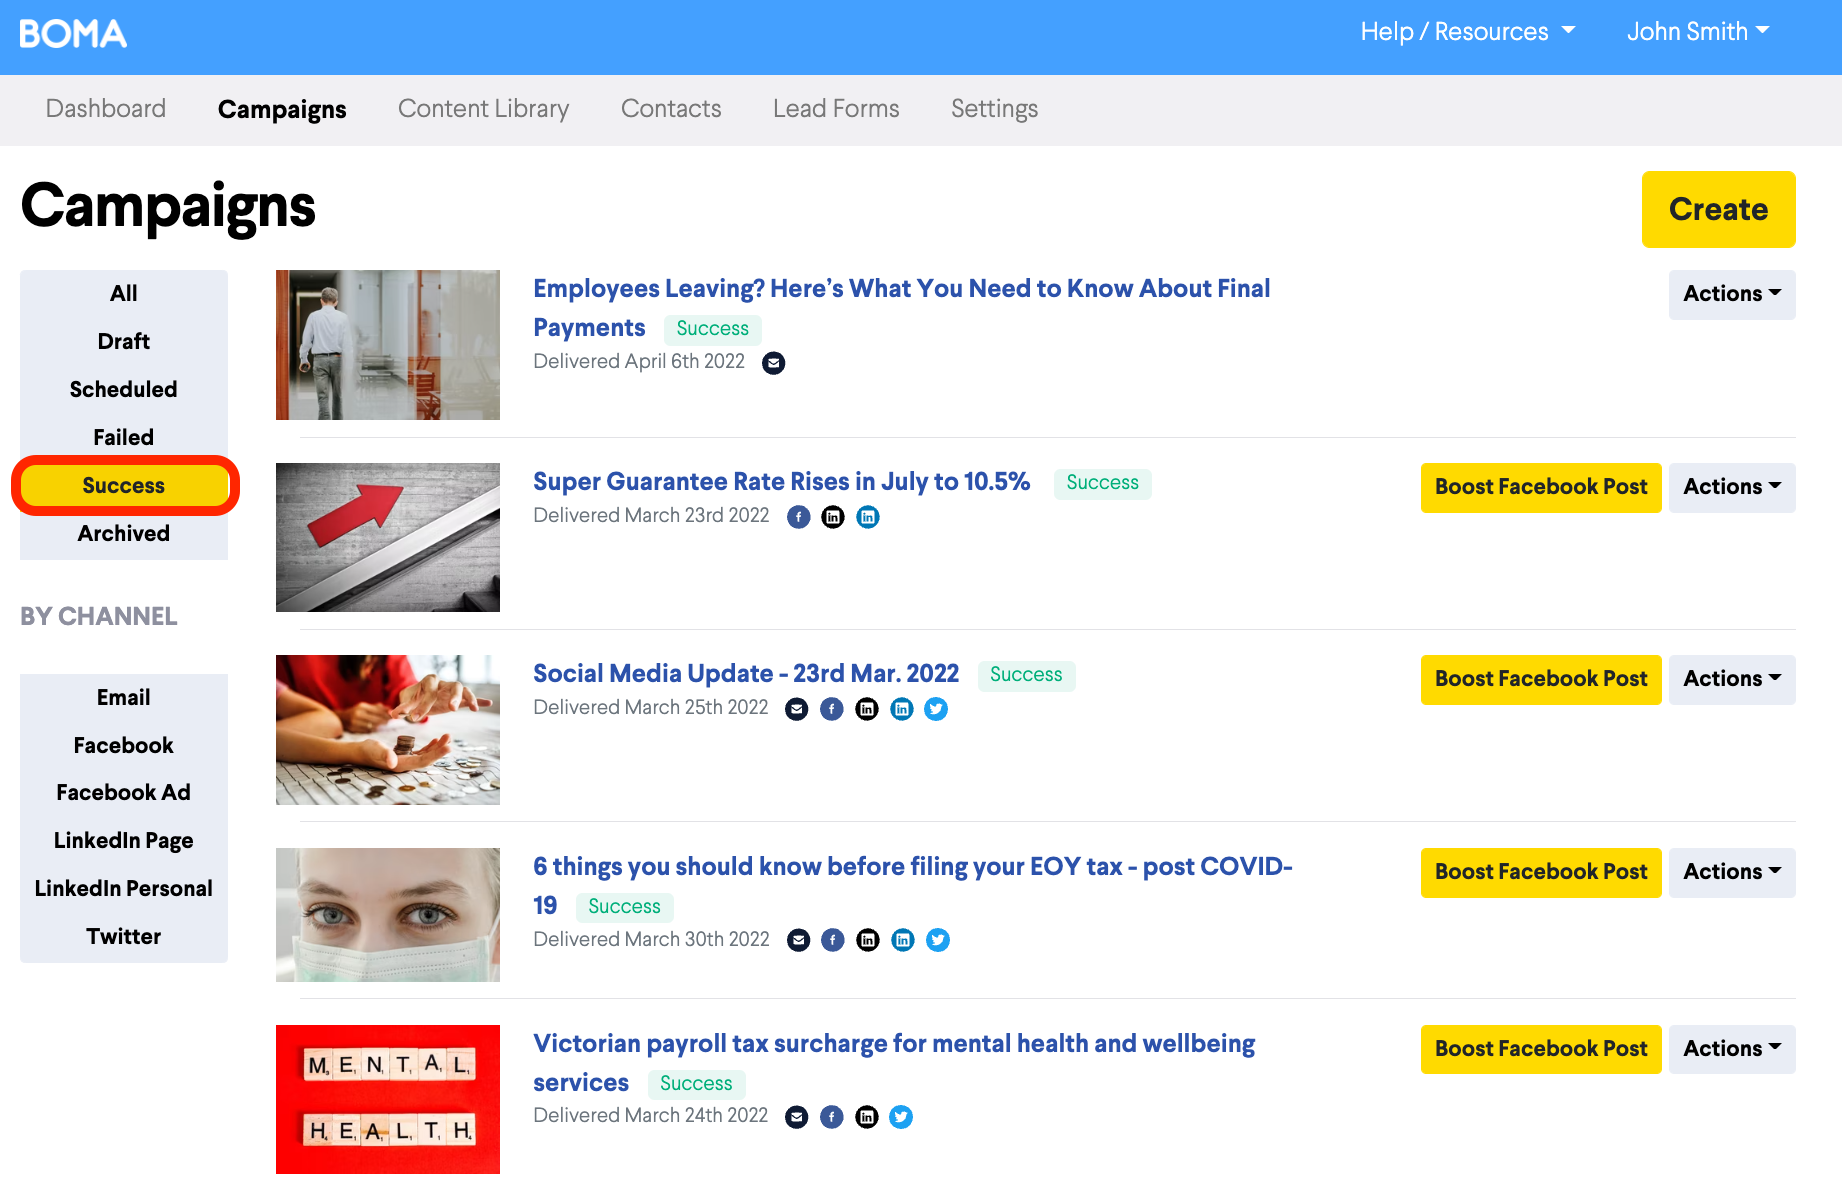
You'll see a list of all the campaigns created in your account. Click on the Success tab in the left hand menu and then select the campaign you want to view.
On this page you can see the statistics for your campaign by channel.
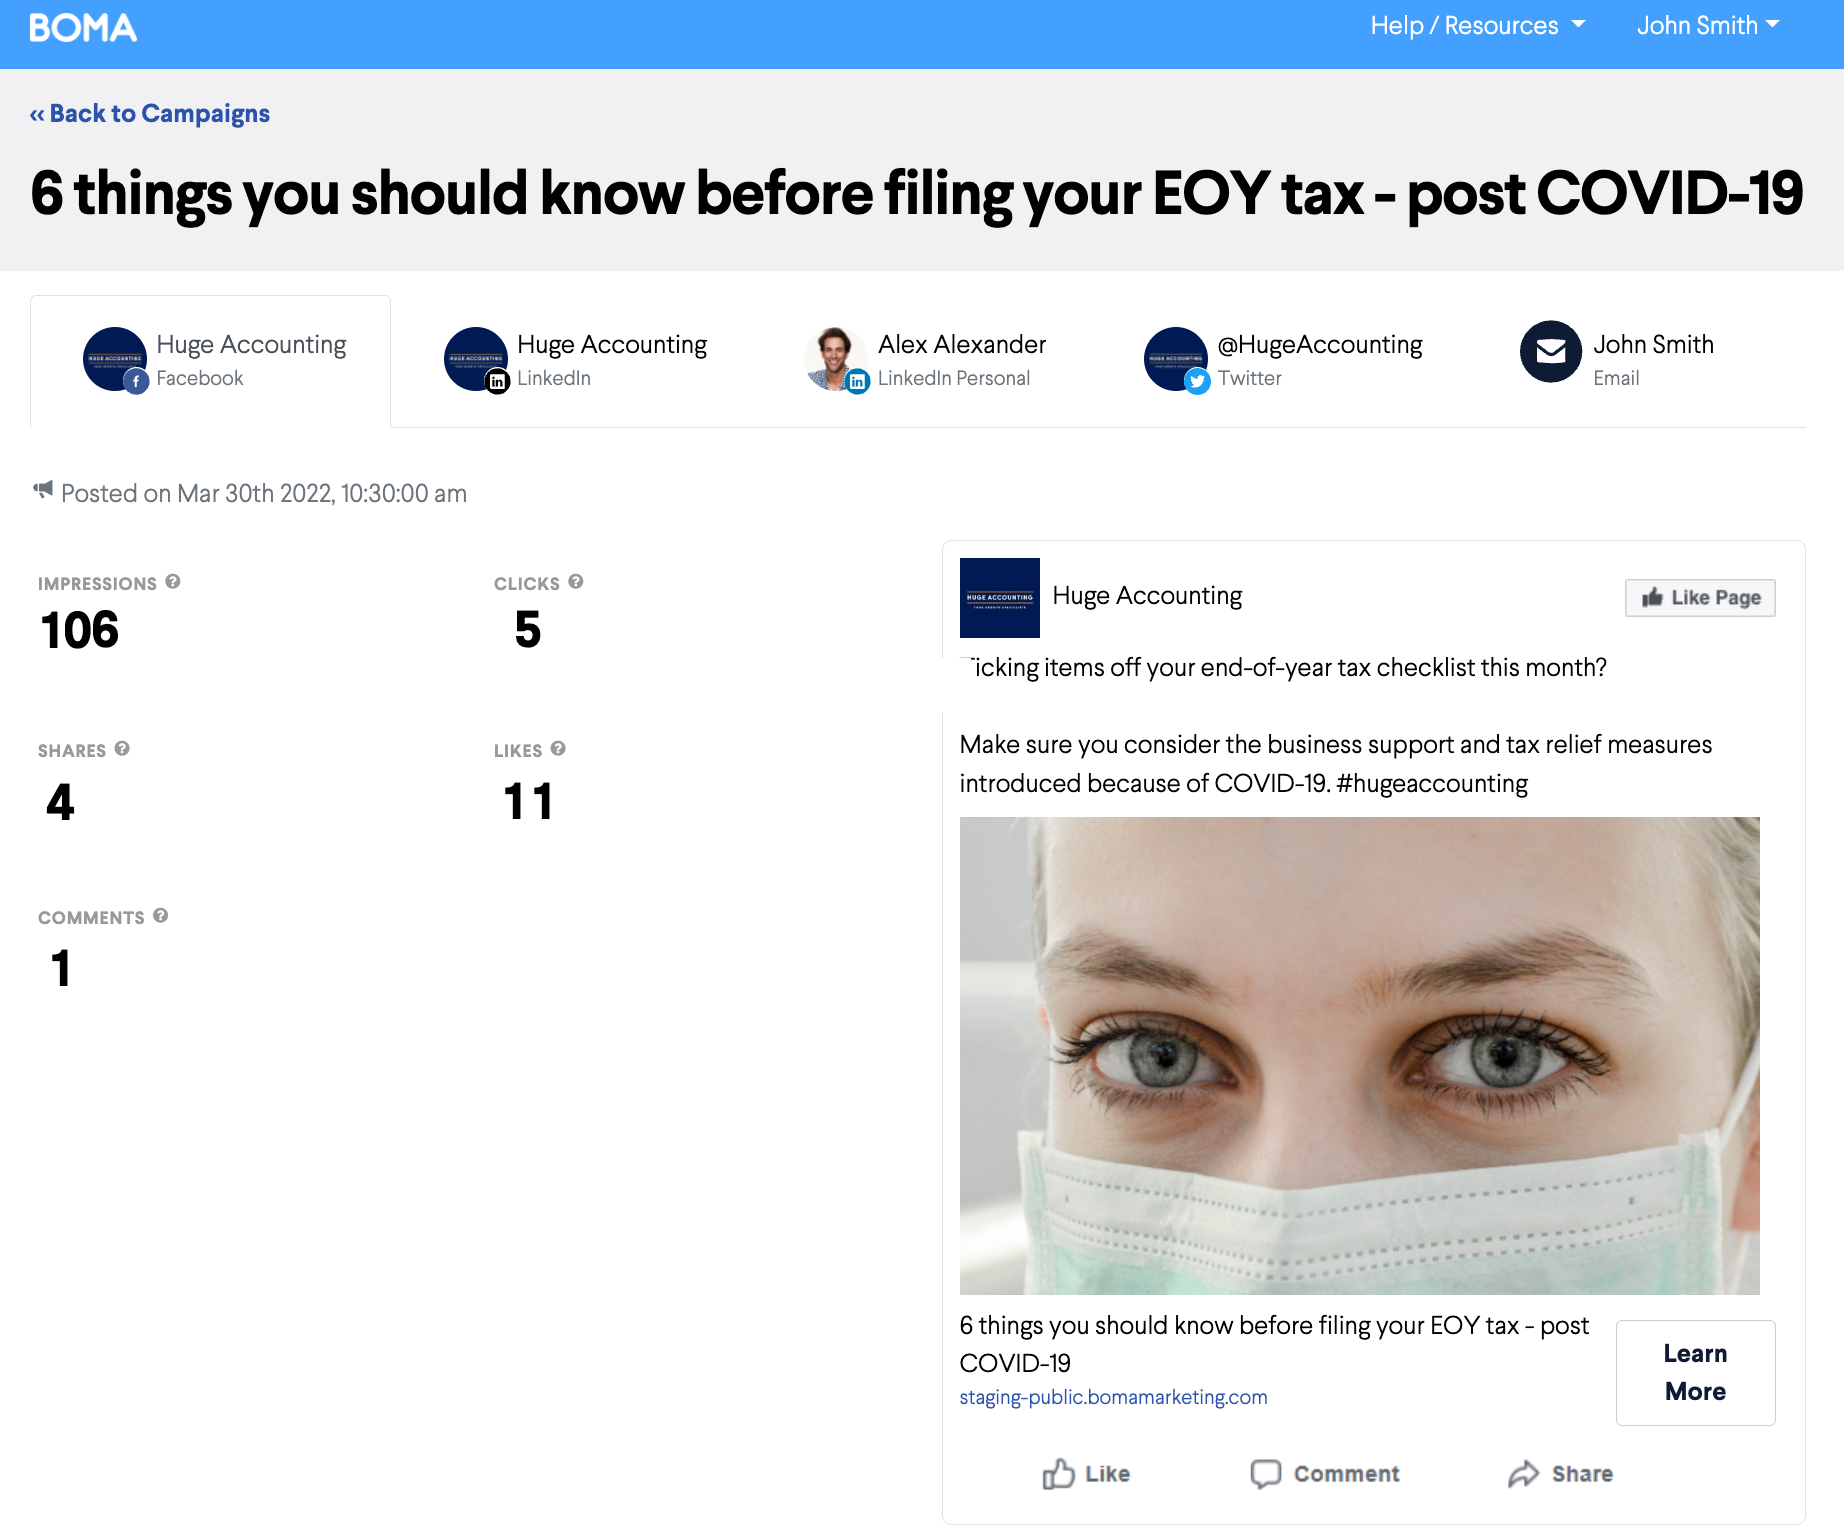
Here are some tips to understanding what each segment means.
Email Metrics
Opens & open rate - gives you a clear picture of how many people opened your email. It can help you understand how enticing your subject line is (if it's not enticing, people are less likely to open) & how engaged your email list is with your company/brand.
This varies by industry and by list but aim to improve them with better subjects and content.
Clicks - will tell you if the content in your email is useful and engaging for people, the more it is, the more likely people will click through to your call-to-action for more information.
Bounces - If an email bounces you may have an old email address or the user may have blocked your emails because they are not relevant/too frequent etc.
Emails can also fail when someone's email server is full or unavailable - email address may in fact be correct and just currently unavailable.
Social Metrics
Impressions - the number of times your post has been shown to users.
Likes, shares, comments & clicks - are a very clear indication of how engaging your content is. The better or more engaging it is, the higher levels of these engagement metrics you should see.
Please note:
Measure these metrics against the number of followers you have. For example, if you have 100 followers then 10 likes is a 10% engagement metric which is great, but if you have 1000 followers it's 1% so something to account for when reviewing.
Further Reading:
Understanding dashboard analytics
What is the best way to analyse my campaign?